Visual Studio 2010 and .NET Framework 4.0

Mon, September 29, 2008, 09:18 AM under Links
...are the names of our next release that developers can look forward to (it is great to finally be able to talk about some of the new features publically... even though I have already hinted at a couple e.g. here ;-).

Soma made the announcement; his blog post focuses on the VSTS SKU. The theme continues on channel9 all week.

Also just noticed the presspass announcement and MSDN page.

The future: Spatial Computing

Sun, September 28, 2008, 09:42 PM under Links
...according to Craig Mundie. The 2 videos on that page are demos that I've seen internally before and I especially like the first demo, check it out. Beyond the videos the report looks good too. Favorite quote:
"We have to master the transition to a parallel programming environment, with highly distributed, concurrent systems."
Read the full article.

Parallel Stacks for multi-threaded debugging

Sat, September 27, 2008, 02:57 PM under ParallelComputing
My previous post (on active stack frame and current thread) ended by raising an issue, a solution to which I propose below.

Consider the following screenshot of code (inc. snippet from Threads window) that has hit a breakpoint and envisage the call stacks for each thread before reading the rest of this blog post:


As a developer debugging a multi-threaded app, you need the ability to view call stacks of multiple threads at the same time – not just a single one at a time. What would you wish this to look like? The obvious solution would be a window like this:


If we can get to the stage above, why not aim for a few more goals: Draw it as a call graph (method calls go from top to down) and, more importantly, visually indicate when threads share common method call paths. Here is a picture (identical info to previous picture) delivering on those goals:


The “xN” indicates that the call stack segment box is shared by N threads. To piece together the entire call stack for a thread, we mentally concatenate the boxes vertically. So the diagram above reads as follows:
"One thread started in Main. It then called A; A was called by 3 threads in total, so we can deduce that 2 other threads have started their life in A. Of the 3 threads, 2 called B (and that is where their active stack frame is right now). The remaining one thread from A called C and subsequently an AnonymousMethod from C and that is where its active stack frame is now (this is also the current thread)."

What do you think? How can you make this better or what alternative do you propose?

PDC2008: Can you afford not to be there?

Wed, September 24, 2008, 03:05 PM under Events
When I previously blogged about PDC, I hinted that in addition to the pre-conference and the 4 breakout sessions, there would be "even more on the final day of PDC" from the Parallel Computing Platform. The details are now public: make sure you attend the 3 additional sessions of the Parallel Computing symposium on
"A Detailed Look at How Multi-Core Architectures will Unleash Computing Power and Enable Innovation"

Beyond parallelism, we also published additional Windows 7 sessions (inc. a keynote), 2 of which you can see on a screenshot of my partial agenda:

(note to self: next time I submit a session, make sure it starts with quotes so it appears first on the alphabetical list of sessions ;))

Finally, for the swag-oriented amongst you, the motivation comes in the form of a 160GB USB 2 hard drive (which include pre-Beta bits of Windows 7 plus more)! I asked, and presenters won't receive the drive apparently... oh well...

Register now and see you in the city of angels.

Active and Current (Stack Frame and Thread)

Sun, September 21, 2008, 10:11 PM under dotNET
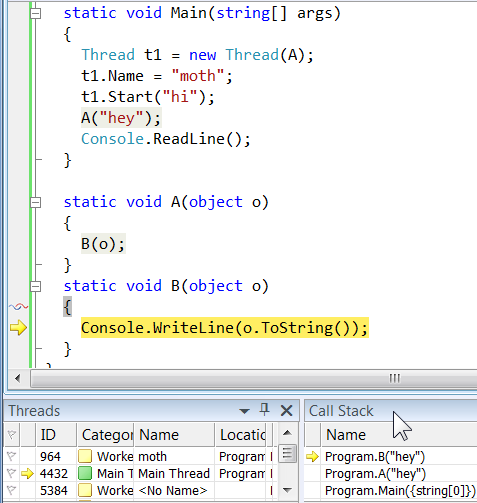
Each thread has a call stack (a list of stack frames, each representing a method call and the relevant state). When you break in the debugger, you can see it in the Call Stack window for the current thread, e.g. bottom right of this screenshot:


The current thread (aka active thread in some circles) is the thread that is currently selected in the Threads window, indicated by the yellow arrow icon (in the screenshot above, the "Main Thread"). By default the current thread is the one that hit the breakpoint (or, for example, the one on which the exception was thrown) which resulted in breaking in the debugger (all threads). You can switch the current thread via the ContextMenu on the Threads window (or by double clicking on a thread in the listview). When changing the current thread, the Call Stack window updates itself.

The Call Stack window indicates the top of stack (the latest stack frame) of the current thread with a yellow arrow icon (in the screenshot above, the “Program.B("hey")”). This is known as the active stack frame. When switching threads, obviously the active stack frame changes. When execution resumes (e.g. via F5), the execution continues from the active stack frame onwards (to be more specific, from the active stack frames of any/all of the threads). The active stack frame, by default, is also the current stack frame for that thread.

The current stack frame is the stack frame that drives the rest of the debugger toolwindows e.g. Locals, Autos, Watch and even the code editor. You can change the current stack frame by using the ContextMenu on the call stack window (or double clicking there). When changing the current stack frame to be something other than the active stack frame, it shows a green arrow. For example, in the following screenshot we double clicked in the Call Stack window on “Program.A("hey")”:


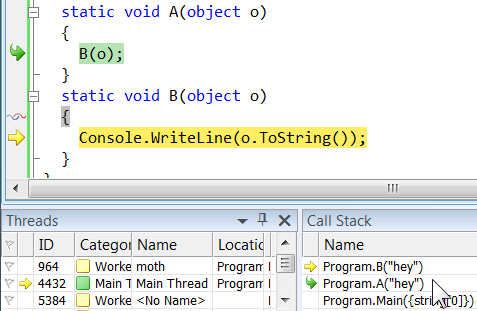
Obviously, if you change the current stack frame, when execution resumes it will still resume from the active stack frame(s). So, setting the current stack frame is purely a temporary action for inspecting the relevant data to that frame, e.g. in the Locals window.

On the screenshot above, notice the 3 icons shown in the margin of the code editor:
1. Yellow arrow: for the active stack frame of the current thread (in our example, of “Main Thread”).
2. Green arrow icon: if we have set the current stack frame to be something other than the top of stack (in our example, “Program.A”).
3. Red and blue cloth threads icon: the active stack frames of all other non-current threads (in our example, “moth”).

Quick Check: If you double click on the “moth” thread in the Threads window, what would the screenshot above look like in terms of icons in the code editor, threads window and call stack window? Picture it first and then check your answer by viewing this screenshot. Did you get it right?

Developers that have not used VS2008 in multithreaded programs, tend to forget the usefulness of the red and blue cloth threads icon. If you are one of those devs, watch my video for a refresher.

Let me ask another easy question: Why don’t we see this new icon anywhere else in the debugger toolwindows? The obvious answer to the question is that: no toolwindow shows active stack frames of non-current threads; hence the cloth threads icon does not appear anywhere.

The real issue here is that we only have a single Call Stack window that can only show stackframes for the current thread. Given that all threads are equal and “current” in real terms, Visual Studio’s notion of “current thread” as the only one we can focus on is limiting (to our productivity at least). In a following post I’ll explore an (imaginary?) solution ;-)

Not all AnonymousMethods are the same

Sun, September 14, 2008, 11:12 PM under dotNET
Whilst debugging code that uses multiple anonymous methods (or lambdas) from a single method combined with multiple Threads, an interesting issue surfaces with the stack frames that Visual Studio 2008 presents.

Can you spot the problem with the following screenshot (original code from this post)? Look at the Location column of the Threads window:

Are both of those Threads with the same location string (Program.Main.AnonymousMethod) at the same place in the code editor? Look at the code editor and the answer is no. The icons with the blue and red “cloth threads” in the gutter of the editor show the two locations: one is at t2.Wait and the other at the Console.WriteLine (you can verify this by hovering over the icons to see the tooltip with Thread info).

Bottom line: The Location column (and Stack Tip) of the Threads window (and the Call Stack window in fact) are not telling you the full truth. They are indicating that thread execution is in some anonymous method, but they are not distinguishing between different anonymous methods. It would be nice if they at least appended a number to the string: AnonymousMethod1 AnonymousMethod2, etc.

Aside: The real method name of the anonymous method in IL code starts with a chevron and is generally funky and it wouldn't add value to be displayed here. All we need is the ability to distinguish between different anonymous methods in the debugger tool windows, hence my suggestion above about suffixing them with a number. Do you have a better suggestion?

Answer to Tasks quiz: you just can't tell

Mon, September 8, 2008, 12:34 PM under ParallelComputing
In a quiz I posted recently, I had some replies in the comments (which are incorrect btw) and more replies over emails that were correct (with a caveat). I am referring to question A (and I touched on the motivation for question B here).

In short, the correct answer to (trick) question A is that the only thing guaranteed is breakpoint #5 will be hit last and BP #1 happens before #2 and #3. There is a race between BP #4 and #1 and then a similar race between BP #2 and #3, which means that we cannot tell the overall order.

Now, I mentioned above that there was a caveat: In majority of replies they stressed that even though we cannot tell for sure, it is likely/probable that BP #4 would be hit before #1 due to overhead of setting up the child Task. Indeed if you run that exact code on your dual core machine, you’ll likely/probably find that that is the case. However, this is certainly not guaranteed or expected.

Take the original code: what 2 statements can we insert at the start of Main (before creating Task t1) that will result in BP #1 being hit before BP #4? Here is one answer:
Thread.CurrentThread.Priority = ThreadPriority.Lowest;
TaskManager tm = new TaskManager(new TaskManagerPolicy(1, 1));
...and of course passing tm as the last argument to the Create methods. Try it!

If you think that changing the thread priority was too artificial/contrived, consider that if it is a kernel event that wakes up the scheduler thread it could result in a priority boost, which has a similar risk of causing pre-emption.

If there is one guarantee about what threads run when, it is that there is no guarantee - and any internal engine (CLR, Windows) has the right to change their implementation details anyway so don't rely on empirical findings.

What are the interesting properties of Tasks at runtime?

Sun, September 7, 2008, 10:44 PM under ParallelComputing
The second question (B) of the quiz I posted here was meant to make you think about the complications of adding a Task reference to the Watch window. I then went on to show how to use Tack.Current and make object id as a technique to help a bit. I continued by taking advantage of the DebuggerDisplayAttribute which essentially results in a productivity boost. The real question though is why during debugging would I want to watch a Task to start with?

Well, my hope is that the Task object would get more public properties that I can use to determine things like e.g. its status. But the real need is to be able to create a holistic view of my system in terms of *all* the Tasks that my code creates explicitly or implicitly. That need is what I’ve been trying to approximate with the Watch window, but so far it has ended up being a very poor solution.

So, my wish as a developer embracing the Task-based programming, is to have some way (e.g. a new VS debugger toolwindow?) of viewing all the Tasks in my system and being able to quickly determine which ones are not scheduled yet (let’s call them Initialized), which ones are Running and which ones have run a bit and now are Waiting on some resource before they can continue. If we imagine that we have this view, then I get greedy and I also want to be able to quickly see the call stack of each Task and also which thread it is executing on. My greed continues to the extent of wanting to easily view the parent-child relationship between Tasks. Have I missed any requirement? What information would you want to see in a dedicated Tasks window?

Use the DebuggerDisplayAttribute for your types

Mon, September 1, 2008, 12:08 AM under dotNET
Using the Make Object ID feature we were able to turn this screenshot into that screenshot.

Building on the Task.Current approach, I wanted to avoid having to expand the variable and instead wanted to get a quick glimpse of the properties of interest with just one glance. Then I remembered the DebuggerDisplayAttribute (part of the nice debugger visualizers wave introduced in VS2005).

The DebuggerDisplayAttribute overrides what you see for a Type in the expression windows, similar to what ToString does (except the attribute takes precedence). Hopefully the TPL team will add one to the Task class by RTM, so the previous screenshots can look something like this:

The way I accomplished that for now is by creating a new class library, referencing the Parallel Extensions library and pasting one line of code:
[assembly: System.Diagnostics.DebuggerDisplay(@"\{Id = {Id}, IsCompleted={IsCompleted}}", Target = typeof(System.Threading.Tasks.Task))]

Then I copied the output DLL to the Visualizers directory (%userprofile%\Documents\Visual Studio 2008\Visualizers). Get the DLL here for VS2008 and remember to do this for your own types so your users don't have to resort to writing their own ;-)