Sat, September 27, 2008, 02:57 PM under
ParallelComputing
My previous post (on
active stack frame and current thread) ended by raising an issue, a solution to which I propose below.
Consider the following screenshot of code (inc. snippet from Threads window) that has hit a breakpoint and envisage the call stacks for each thread before reading the rest of this blog post:
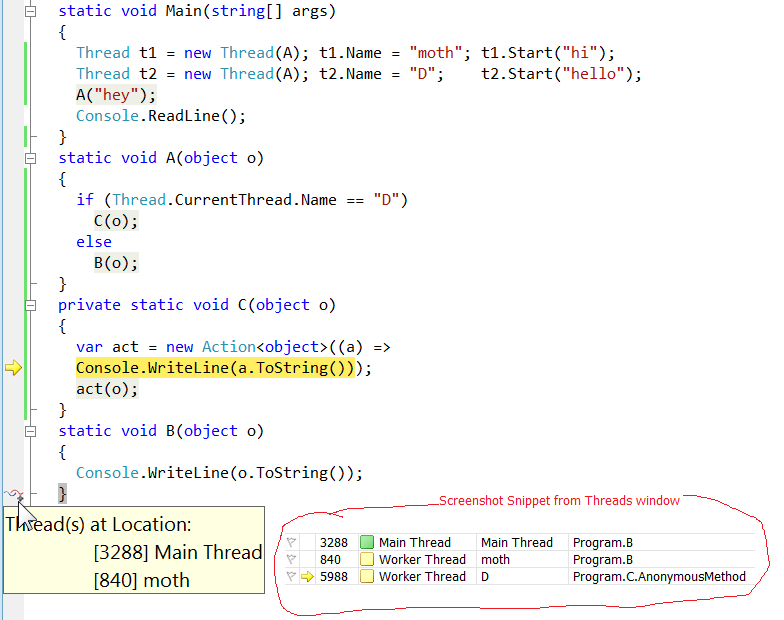
As a developer debugging a multi-threaded app, you need the ability to view call stacks of multiple threads at the
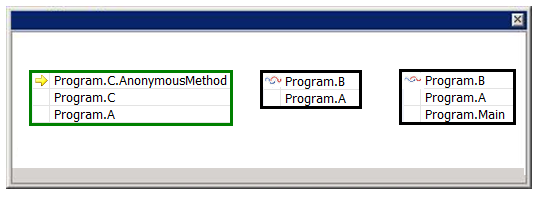
same time – not just a single one at a time. What would you wish this to look like? The obvious solution would be a window like this:
If we can get to the stage above, why not aim for a few more goals: Draw it as a call graph (method calls go from top to down) and, more importantly, visually indicate when threads share common method call paths. Here is a picture (identical info to previous picture) delivering on those goals:
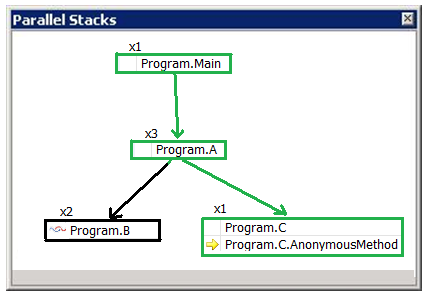
The “xN” indicates that the call stack segment box is shared by N threads. To piece together the entire call stack for a thread, we mentally concatenate the boxes vertically. So the diagram above reads as follows:
"One thread started in Main. It then called A; A was called by 3 threads in total, so we can deduce that 2 other threads have started their life in A. Of the 3 threads, 2 called B (and that is where their active stack frame is right now). The remaining one thread from A called C and subsequently an AnonymousMethod from C and that is where its active stack frame is now (this is also the current thread)."
What do you think? How can you make this better or what alternative do you propose?