Sun, September 14, 2008, 11:12 PM under
dotNET
Whilst debugging code that uses multiple anonymous methods (or lambdas) from a single method combined with multiple Threads, an interesting issue surfaces with the stack frames that Visual Studio 2008 presents.
Can you spot the problem with the following screenshot (original code from
this post)? Look at the Location column of the Threads window:
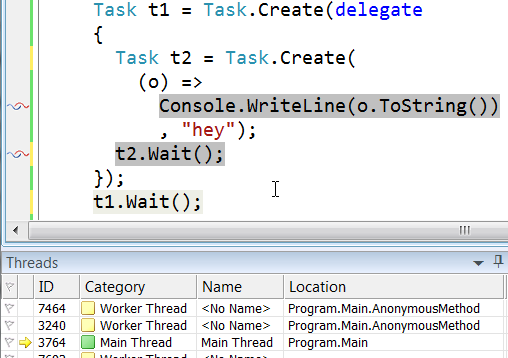
Are both of those Threads with the same location string (Program.Main.AnonymousMethod) at the same place in the code editor? Look at the code editor and the answer is no. The icons with the blue and red “cloth threads” in the gutter of the editor show the two locations: one is at
t2.Wait and the other at the
Console.WriteLine (you can verify this by hovering over the icons to see the tooltip with Thread info).
Bottom line: The Location column (and Stack Tip) of the Threads window (and the Call Stack window in fact) are not telling you the full truth. They are indicating that thread execution is in
some anonymous method, but they are not distinguishing between different anonymous methods. It would be nice if they at least appended a number to the string: AnonymousMethod1 AnonymousMethod2, etc.
Aside: The real method name of the anonymous method in IL code starts with a chevron and is generally funky and it wouldn't add value to be displayed here. All we need is the ability to
distinguish between different anonymous methods in the debugger tool windows, hence my suggestion above about suffixing them with a number. Do you have a better suggestion?