Instructions for collecting dumps in VS2010

Thu, October 29, 2009, 07:11 PM under VisualStudio
Came across this on an internal email thread and thought it would be useful to share, in case you run into a VS crash and wish to collect the information needed by Microsoft support.

1. Start 2 instances of Visual Studio 2010 (devenv.exe).
2. In the first one select Tools -> Attach to Process.
3. Click the Select button for “Attach to:” and select Managed and Native.
4. Select the other devenv from the list and click Attach.
5. Switch to the other devenv.
6. Load your solution and try to reproduce the crash.
7. When you hit the crash the debugger should automatically break.
8. Select Debug -> Save Dump As, then set the type to minidump with heap and save the file to a location with lot’s of space.

Note: If you are running the VB profile you will not see the Save Dump As menu item. To add this menu item:
a. Select Tools -> Customize
b. Select the Commands tab
c. Select Debug from the “Menu bar” dropdown
d. Click “Add Command…”
e. Select Debug from the Categories list.
f. Find the “Save Dump As” entry in the Commands window.
g. Click OK (the “Save Dump As…” command is added to the top of the Debug menu).
h. Click “Close”

Positioning the Parallel Stacks window

Thu, October 22, 2009, 08:22 PM under ParallelComputing
When we developed the Parallel Debugging windows, we had to choose their default position in Visual Studio. For Parallel Tasks it was easy: we chose wherever the Threads window appears by default, since the two windows share characteristics in usage and appearance. Parallel Stacks may be similar to the basic concept of the Call Stack window, but it has slightly different usage patterns and very different UI. Here I'll describe our rational for the current choice for the Parallel Stacks window, offering tips and request feedback.

It was more challenging that just picking a position at random, especially due to the window having high screen real estate demands for typical applications – after all, it is a graphical view of all the call stacks of all the threads/tasks in your application. So, we quickly dismissed having it docked at the bottom or top since those are typically narrow in height windows. Some of us believed that the document editor area would be a good place for it since it has more screen real estate to offer. That approach breaks down when you realize that the Parallel Stacks window is not just presenting data, but it also allows you to quickly switch to any stack frame of any thread (with a double click). When that user action takes place, the code editor navigates to the method context and thus steals the focus from the Parallel Stacks window which gets pushed to the back (this also happens when you simply toggle the "Show External Code" option). So if you want to navigate to various places in the code via a series of examinations, that position quickly becomes irritating (just like if you docked Solution Explorer in the code editor area).

So we decided the default position to be floating! The idea is that you can resize it based on your preferences and move it in and out of the way if necessary: you get to see as much of it as you want and you keep it on top of other windows (typically to the right side). The real expectation is that you will drag the floating window to your second monitor and maximize it there.

Two other options came close to be chosen and I'll offer them here as tips in case they suit you better (in particular if you don't have a second monitor or when debugging on the go on your laptop). One is to dock it within the document editor, but in a New Vertical Tab Group. This way it takes up the space it typically needs, while keeping your code editor in view when you switch stack frames.


The other option is to dock the Parallel Stacks window where the Solution Explorer window lives. That way you can resize that group of windows horizontally to see more content (and use for navigation) without taking too much away from your code view (assuming your lines of code are not extremely long). When you are done using it, you can quickly resize it back to normal.


It is amazing how much thought/discussion goes into, what many people would consider, an insignificant detail, but that is the kind of thing I enjoy, which I guess is why I do what I do. In any case, I am eager to hear how we got this decision wrong, so please let me know.

Window Positions in Visual Studio

Tue, October 20, 2009, 05:04 PM under VisualStudio
There are many toolwindows in Visual Studio and each release keeps adding new ones. This is great for offering more features and increasing productivity, but it also adds to the number of windows we need to manage and it makes it even more important to understand how the positioning works in VS (and most of this applies to toolbars as well).

The first important thing to understand is that there are 3 different window configurations persisted per user on the machine.
1. The standard configuration: the default when you open a solution in Visual Studio.

2. The debugging configuration: the one when you hit F5 (and a little window earthquake takes place while everything readjusts).

3. The often forgotten, full screen configuration when you hit Shift+Alt+Enter, in any of the previous configurations


Once you understand the above, you should never utter the words: "didn't I just close that window, why did it come back", which we typically hear from presenters on stage after hiding, for example, Solution Explorer and then when they hit F5 it comes back. You need to hide (or otherwise position) each window for every one of the 3 configurations if you really want it to be like that all the time. Another example is if you decide to move the Breakpoints window in standard configuration, don't be surprised if it pops up somewhere else when you debug: to make sure it appears at the same place always, you need to move it to where you want in all configurations. Understanding the above also means that you won’t be looking for the Parallel Tasks window when in standard configuration since it is a debugging window and hence applicable only when in debugging mode. I hope the point is made.

The second most important thing to understand is that each window has a default position for each one of the configurations. Those default positions are different per profile that you chose the first time you run Visual Studio. Just because you have some defaults, it doesn't mean you need to stick with them, so choose what is best for you.

So what are the two basic choices we make per window?
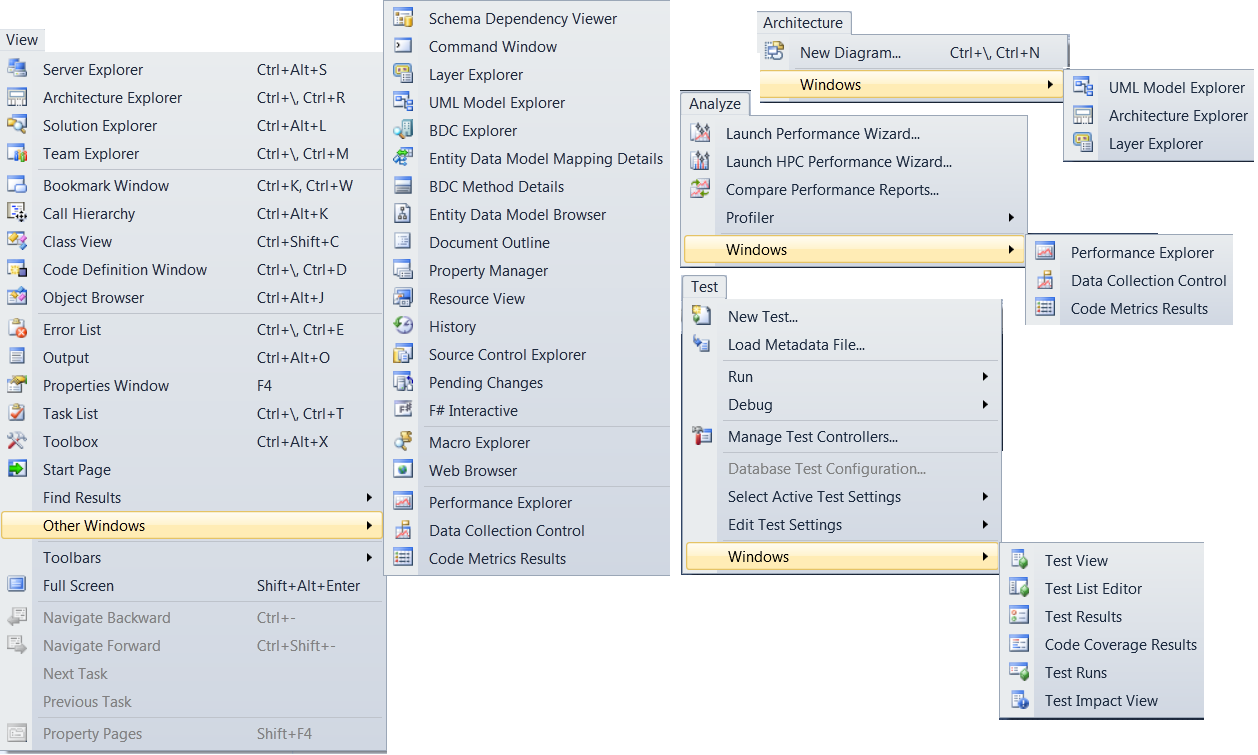
A. Is it hidden or visible. If it is hidden, we should at least know where it lives on the menus so we can bring it up when we need it (and thus avoid the "out of sight, out of mind" pitfall). So go ahead and explore all the menus under the View menu and don't forget the ones under Architecture, Test and Analyze:

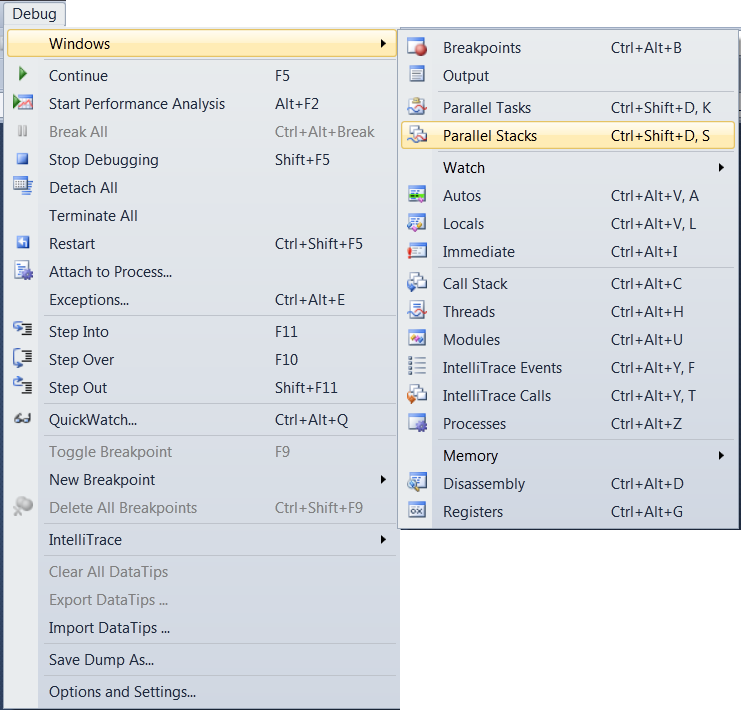
Don't forget that menu options change when you are in debugging mode, so explore the Debug menu once you've hit a breakpoint:

TIP: If you are not familiar with all of these windows above, maybe you are not the VS power user you thought you were ;-)

B. If you've opened a window, it has a default position that each profile team chose. You need to decide where it lives: floating (this is usually a temporary state or used on the secondary monitor, combined with MAX options), docked to the left/right/top/bottom (further decision if it is pinned or autohides controlled via the pushpin) or even docked to the center as a tabbed document (see the drop down options in the screenshot of the link).

With regards to moving a window around for docking I often observe people fighting the IDE, especially since each docking target can have multiple side-by-side groups. It is quite simple. Drag the window towards your desired area and look out for blue shaded region to appear, it represents where your window will go: if you like that position then you can release the mouse button; if you don't, keep moving the window. Along with the blue shadowed region, you also get some arrow targets appearing that you can drag the mouse pointer over (while still keeping the mouse button down so as not to release the window). Here is a screenshot of dragging the Parallel Stacks window towards the top and moving the mouse over the left arrow box that appeared.

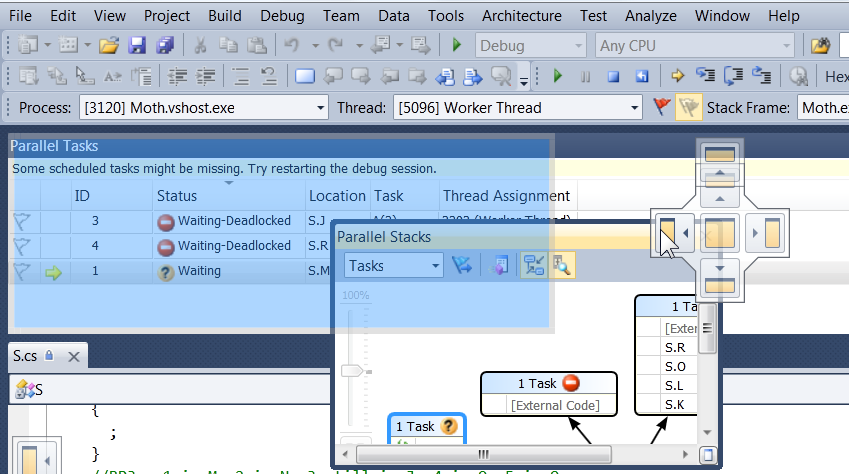
After this screenshot was taken I released the mouse button and a new window group was created next to the Parallel Tasks window that was occupied by the Parallel Stacks window. If I wanted it to join the same group as the Parallel Tasks window, I would have dragged towards the middle box and released then.

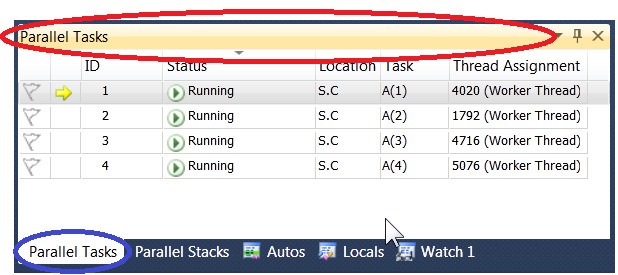
TIP: if you want to drag a window out of its group to floating, don't drag it by the title bar, but instead drag it from its tab. I.e. in the following screenshot, dragging from the title bar (red circle) will float the entire window group whereas dragging from the tab (blue circle) will float just the Parallel Tasks window.


Finally, you can backup and restore the window layouts via the Tools-> Import and Export Settings menu. FYI, they are stored on your machine in this folder: "%userprofile%\AppData\Roaming\Microsoft\VisualStudio\9.0". Look for the windows.prf and windowsidx.prf files. I found that via this msdn link.

Visual Studio 2010 Beta2 (build 21006)

Mon, October 19, 2009, 09:11 AM under VisualStudio
MSDN Subscribers can download Visual Studio 2010 Beta2 today with general public availability to follow in a couple of days. Official blog posts by Soma.

I have been using this since October 8th (2 days after it was built as you can tell from the build number) and it is amazingly better than the Beta1 in terms of performance, stability and new features too. It is worthy of its "go-live" license.


More posts to follow from me on VS2010; for now, I just updated the VS Profile screenshot and the Parallel Debugging content.

Parallel Tasks and Parallel Stacks content updated for VS2010 Beta2

Mon, October 19, 2009, 08:59 AM under ParallelComputing
For VS2010 Beta2, rather than write new introductory and overview posts on my two favorite debugger windows (Parallel Tasks and Parallel Stacks), I thought I’d update 4 of the existing blog posts on those topics.

Please read the updated text and enjoy the updated screenshots
- Parallel Tasks
- Parallel Stacks
- Parallel Stacks – Tasks View
- Parallel Stacks – Method View

Also, I have updated the recordings behind the screencast URLs on channel9:
- Parallel Stacks
- Parallel Tasks

Each one of the links above has a comment section, feel free to use it for feedback and questions!

Installing HPC Server 2008

Sun, October 18, 2009, 08:47 PM under ParallelComputing | HPC
Recently I decided to play around with developing for a cluster on the Microsoft platform and below are the steps I had to take with regards to installation.

First I gathered a number of old machines at the office, in my case that is 3 dual-core boxes, but you could have done it with just 2 PCs (or many more of course). On each one of those you must install: Windows HPC Server 2008 (link to trial)
a. This includes a trial of the Windows Server 2008 RTM 64-bit operating system (SRVHPC_EN.iso). I already had Windows Server on a separate disc, so I installed what I had. I did not try R2, which is the same code base as Win7, but that should work too. Note that this is just the vanilla operating system (even Standard Edition is good enough) and the important part is the 64-bit. I will assume that you are all capable of installing an OS, so no more instruction or special consideration needed here (window update, join domain, add users etc).

b. The second part of the link above is an add-on to the operating system, namely the HPC Pack 2008 (HPCEval.iso). It is a wizard with a set of steps to complete which are all fairly explanatory of the "click Next" flavor. After installation of the HPC Pack, the HPC Cluster Manager application runs up automatically (or else you can run it through the Start menu) for further step-by-step configuration in an easy to follow outofthebox To-do List.


Here are some tips for step b from above, for your developer cluster setup:
i) In the HPC Pack wizard, you will create one of the machines as the Head Node.

ii) In the HPC Pack wizard, the remainder machines will be created as the Compute Nodes.

iii) In Cluster Manager, click on "Configure your network" and choose topology 5 "All Nodes only on an Enterprise Network".

iv) In Cluster Manager, click on "Add compute nodes" and then select "Add compute nodes that have already been configured".

v) In Cluster Manager, click "Change the role of the head node" and also make it a WCF Broker Node.

vi) In Cluster Manager, "Validate your cluster" under Diagnostics.

It may be useful to cross-reference the text above with the following screenshot of HPC Cluster Manager


Now that your cluster is installed, you need to set up your development machine (x86 or x64) for developing on this cluster. Here are the things you need to install:
1. Visual Studio 2010

2. HPC Pack 2008. This is essentially the same msi you installed on the server (step b above), but here you will choose the 3rd option Client Utilities (which will probably be your only enabled option as per my screenshot further above).

3. HPC Pack 2008 SDK. This allows writing client applications that interact with the Job Scheduler running on the Head Node. MSDN has a dedicated page to the HPC SDK.

4. (optional) Install the separate MPI Project Template, for VS2010.

You are now ready to develop your cluster applications on your development machine and to debug/deploy them on your cluster. More on that in future blog posts.

PDC09 or SC09

Fri, October 16, 2009, 05:19 PM under Events
Recently I was given the choice to attend the PDC09 or the Super Computing conference: SC09. They both run in the same week, so attending both was not an option.

From a personal perspective I like visiting new cities, but in this case I have been to both Los Angeles and Portland so that is not a factor. From a geek perspective I like getting a feel for as many conferences as possible and I did PDC last year (repeated at Tech ED EMEA), whereas I have never been to an SC conference – so that tipped the balance a bit. More importantly from a more_useful_to_my_job perspective, I need to "connect" with more developers that are interested in the HPC and GPU space… This is the customer I want to delight with the work our team will deliver beyond VS2010…

If you, dear reader, are going to PDC09 be assured that the work our team is delivering in VS2010 will be well represented. View the relevant PDC sessions here.

If you are planning on attending SC09, please drop me a note (via the email link on the left) so we can meet and have a chat in Portland…

Parallelizing a loop with tasks, avoiding the pitfall

Tue, October 13, 2009, 02:39 PM under ParallelComputing
Most readers of this blog should know that it is extremely easy to parallelize loops with .NET 4. So serial code performing matrix multiplication like this:
    for (int i = 0; i < size; i++)
{
for (int j = 0; j < size; j++)
{
int tmp = 0;
for (int k = 0; k < size; k++)
{
tmp += m1[i, k] * m2[k, j];
}
result[i, j] = tmp;
}
}
…can be parallelized like this:
      Parallel.For(0, size, (int i) =>
{
for (int j = 0; j < size; j++)
{
int tmp = 0;
for (int k = 0; k < size; k++)
{
tmp += m1[i, k] * m2[k, j];
}
result[i, j] = tmp;
}
});
How about parallelizing the code using Tasks directly (instead of indirectly)? The clever thing to do is somehow partition the data (statically or dynamically) and assign chunks to tasks, but even the naïve approach of one task per outer iteration is better than nothing:
    Task[] tasks = new Task[size];
for (int i = 0; i < size; i++)
{
tasks[i] = Task.Factory.StartNew(() =>
{
for (int j = 0; j < size; j++)
{
int tmp = 0;
for (int k = 0; k < size; k++)
{
tmp += m1[i, k] * m2[k, j];
}
result[i, j] = tmp;
}
});
}
Task.WaitAll(tasks);
Can you see the issue with the code above?

TIP: the issue has nothing to do with tasks, threads or even .NET 4. It has to do with anonymous methods since the day they were introduced. The clue is that the following snippet fixes the issue:
    Task[] tasks = new Task[size];
for (int n = 0; n < size; n++)
{
int i = n;
tasks[n] = Task.Factory.StartNew(() =>
{
for (int j = 0; j < size; j++)
{
int tmp = 0;
for (int k = 0; k < size; k++)
{
tmp += m1[i, k] * m2[k, j];
}
result[i, j] = tmp;
}
});
}
Task.WaitAll(tasks);
If you know the reason please move along. If however this was news to you, go read the entire page (and the outbound links) on stackoverflow.

By the way, we could have fixed the snippet with this approach too, since tasks accept a state parameter:
    Task[] tasks = new Task[size];
for (int i = 0; i < size; i++)
{
tasks[i] = Task.Factory.StartNew(ii =>
{
int iii = (int)ii;
for (int j = 0; j < size; j++)
{
int tmp = 0;
for (int k = 0; k < size; k++)
{
tmp += m1[iii, k] * m2[k, j];
}
result[iii, j] = tmp;
}
}, i);
}
Task.WaitAll(tasks);
More on why you may choose to pass the variable as state instead of capturing it, in a future post.

Visual Studio Profile

Fri, October 9, 2009, 04:51 PM under VisualStudio
Visual Studio 2005 introduced the concept of profiles (which still exists in VS2008 and VS2010). You first experience that through the annoying dialog you see the first time you launch VS asking to bucket yourself into one of General, Project Management, VB, C#, C++, F# and Web.

TIP: Click on each one of the options in the list to read the description on the right that gives insight into what will happen.

Once you choose your label, you get default settings that the product teams decided around default window & toolbar layouts, order of choices in the New Project dialog, menu configurations and keyboard shortcuts.

I guess I was used to the configurations of VS.NET 2002 and VS.NET 2003 so I did not embrace this VS2005 feature. FYI, I always pick General, which largely represents the settings that the early version of Visual Studio had and the one that caters better for developers programming in more than one language.

The profile concept gives the product teams the power to say things like (NOTE: I am making up these examples!) "you are a VB developer, I don’t think you need the Threads window shown by default" or "you are a C# developer, you have no use for the Object Browser" and so on. As a developer, I'd rather see everything. Moreover, most settings that are pre-chosen can be changed via the Tools->Options dialog so why try and bucket me, just try to educate me more about how to configure things. In any case, that is probably the saving grace for the feature: you can override and change most of the decisions made on your behalf. This is another reason you must navigate every option in the Tools->Options dialog, which I always advocate to new VS users. Besides creating, you can also persist your own settings via the Tools->Import and Export menu and can even create macros attached to toolbarbuttons for switching fast between them.

To reset VS completely (which includes asking again for a profile choice when you start it next time), from an elevated VS command prompt type: devenv /resetuserdata (warning: all your preference settings will be lost, so back them up). Try the various profiles (with your existing projects) to see what you may be missing…

Windows Mobile development in VS2010

Wed, October 7, 2009, 09:55 PM under MobileAndEmbedded
With the release yesterday of Windows Phone (press release , blog post , training , launch site) and with the upcoming release of Visual Studio 2010 Beta2, we are starting to see the question again: "where is the smart device development support in Visual Studio 2010?".

This question was asked a lot during the VS2010 Beta1 timeframe and the answer remains the same: Mobile Development Tools are now aligned to the mobile platform releases and are hence decoupled from Visual Studio releases, so I personally guess we should see tool support in VS2010 when a new mobile platform is released. For now, stick with VS2008 for device development needs (official statement) and keep an eye on the Windows Mobile Development Center.

Visual Studio 2010 floating windows can be maximized

Mon, October 5, 2009, 08:47 PM under VisualStudio
Sometimes the little features give you the most pleasure. At long last, Visual Studio 2010 floating toolwindows can be maximized via the maximize button (or double clicking on their title bar, of course). This featurette came late in the Beta1 cycle.

Below a screenshot of the maximize button (when window is floating) plus the menu options when you hit the triangle drop down indicator on the title bar. Also circled in red the maximized button appearance when the window is maximized:


When you combine the floating window maximization support with the VS2010 multi-monitor support, you get the productivity of being able to quickly drag a window to the other monitor, maximize it (and when you are done, restore it and return it).

As I keep saying about VS2010, ILTNUI (I Love The New UI).

Visual Studio Documentary

Thu, October 1, 2009, 01:00 AM under Links
Hopefully anyone reading this blog monitors ch9, but on the remote chance that is not true, you must watch the two-part brilliant 1-hour documentary on Visual Studio: Part One and Part Two.