This post was UPDATED for the VS2010 Beta 2 releaseAssumed knowledge aka Background ReadingIt is important to understand some of the existing
Call Stack window features. Even if you don't care about this VS2010 feature, you can improve your debugging skills with any version of Visual Studio by
reading that blog post.
Parallel Stacks debugger toolwindowWith applications increasingly having more than one thread and with parallelism gaining momentum, we need the ability to view (and navigate) more than 1 call stack from a single view. Previously I discussed the motivation behind this new window
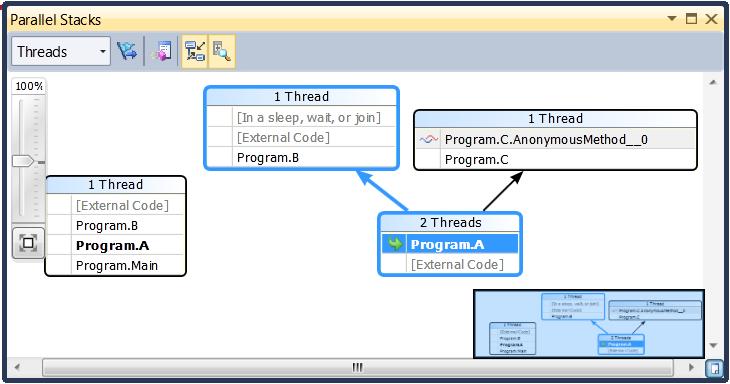
here, and I'll use the exact same code for the following screenshots. Here is the new Parallel Stacks window:
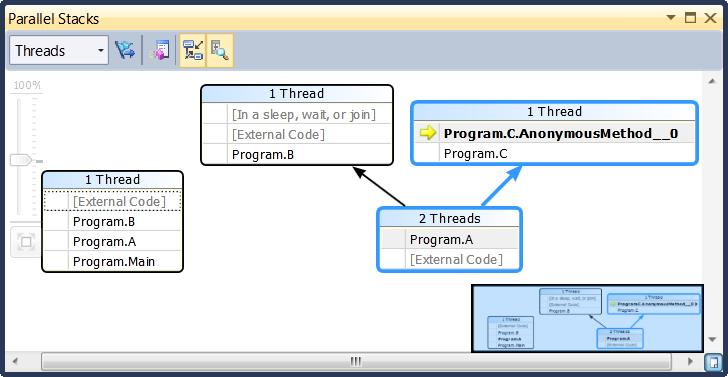
In the picture above you can see the call stacks of 3 threads in a single view. The way you read this picture is that you have one thread that went from Main to A to B. Two other threads started from the same external code and then went to A, but one of them continued to B and then to some external code, and the other continued to C and then some AnonymousMethod. This is also the active stack frame and this is the current thread.
Toolbar buttons from left to right
Threads/Tasks combobox: Switches the view between showing call stacks of threads to showing call stacks of Tasks (and vice versa). More on the Tasks view of the Parallel Stacks window in
another post.
Show Only Flagged: Shows call stacks only for the threads that are flagged in the Threads window.
Toggle Method View: Switches between normal view and method view. Method view is the subject of a
separate post.
Auto Scroll To Current Stack Frame: Auto-scrolls the diagram so the current stack frame is in view. Useful in large diagrams when changing the current stack frame via other windows or when hitting a new breakpoint.
Toggle Zoom Control: Shows or hides the zoom control. Note that zooming is always available via
Ctrl+mousewheel.
Context Menu Items in random order
The last 5 menuitems are borrowed directly from the Call Stack window and introduce no new behaviors:
Go To Source Code,
Go To Disassembly,
Show External Code,
Hexadecimal Display,
Symbol Load Information and
Symbol Settings.
Go To Task (Thread): This performs the same function as the combobox on the toolbar does, but additionally keeps the same stack frame highlighted. It will be discussed in a separate post.
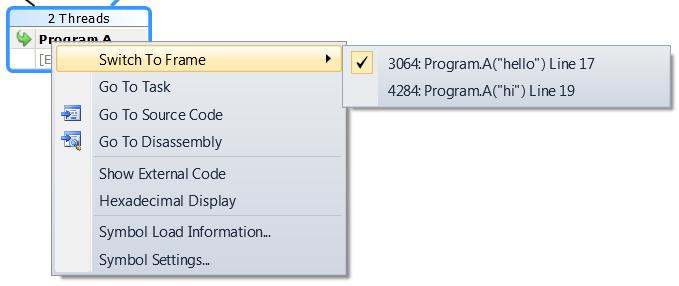
Switch To Frame: Same as menuitem on Call Stack window. Additionally, with Parallel Stacks, multiple frames may correspond to a method context so the menuitem has submenus, each representing a specific stack frame. If one of the stack frames is on the current thread (so by definition you are clicking on a node with a blue highlight around it) then that stack frame has a checkmark in front of it. For example, right clicking on Program.A and expanding the first menuitem results in this screenshot:
 Annotations and Elements ListedCall Stack Segment or Node:
 Each "box" contains a series of method contexts for one or more threads. If the node has no arrow lines connected to it, then it represents the entire call path for the thread(s), otherwise you need to follow the arrows to piece together the entire call path of a thread.
Blue Highlight: The blue highlight indicates the call path to which the
current thread belongs to.
Arrow lines: Arrow lines connect nodes to make up the entire call path for the thread(s).
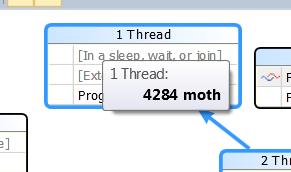
Tooltip on Node Header: The tooltip on each node shows the ID(s) and name(s) of the thread(s) relevant to the node.
 Method Context:
 Represents one or more stack frames in the same method.
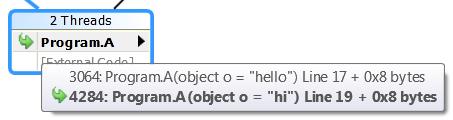
Tooltip on method context: The tooltip on each method context shows the full details of all the stack frames it represents. If one of the stack frames is also on the current thread, it is shown in bold font.
 Yellow Arrow Icon:
 A yellow arrow in front of a method context indicates that the
active stack frame of the current thread is in that method context. As you'd expect, this icon would appear only at the last frame in a node that also has the blue highlight around it.
Cloth Threads Icon: A cloth threads icon in front of a method context indicates that the active stack frame of a non-current thread is in that method context. As you'd expect, this icon would appear only at the last frame in a node and there would be no blue highlight.
Green Arrow Icon: A green arrow in front of a method context indicates that the
current stack frame is in that method context. That method context is also in bold font, and as you'd expect is in a node with a blue highlight. If the method context appears in other places/nodes on the diagram, it is bolded there too. E.g., if in the context menu shown above, we clicked on menuitem '4284: Program.A("hi") Line 19' we would be switching thread and current frame on that thread with a single action, resulting in the picture looking like this:
 Navigation AidsBird's Eye View:
 When there are scrollbars present, the space between the scrollbars reveals a button that when pressed shows a thumbnail view of the picture which you can use to quickly scroll around it.
Zoom Control: The zoom control lets you zoom in and out, zoom to fit and zoom to 100%.
Panning: Pressing the mouse button on any white space and dragging, will scroll the diagram.
Call to ActionThe call to action is identical to the Call to Action of my post on
Parallel Tasks. Read it and come back here to comment ;-)