Wed, May 27, 2009, 04:12 PM under
ParallelComputing
This post was UPDATED for the VS2010 Beta 2 releaseThis blog post presumes you read my posts on
Parallel Tasks and on
Parallel Stacks, which describe the usefulness of the new VS2010 debugger windows for debugging multithreaded applications. In today's post I'll expand on the task-specific support in the Parallel Stacks window: we call this the
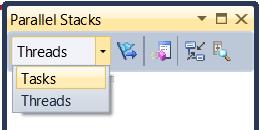
Tasks View of the Parallel Stacks window and you can switch to that view from the combobox in the toolbar.
 Threads versus Tasks
For the purposes of this window, there are 3 main differences when you are looking at call stacks of threads versus call stacks of tasks:
1. Some threads in your application will be running tasks and others will not.
2. A thread could be running more than 1 Task (only the task at the top part of the thread's call stack is actually running, you can assert that the other(s) would be in a waiting state).
3. Call stacks of threads are mapped back to the thread via the Thread ID; call stacks of tasks should be mapped back to the task via the Task ID.
These 3 differences map to the following 3 observations of what you see in the Tasks View of the Parallel Stacks window (compared to the separately covered
Threads View of the Parallel Stacks window):
a) We don’t show the threads not executing tasks.
b) We split call stacks of threads executing multiple tasks into separate nodes, so you can clearly see each task call stack separately.
c) The tooltip of the header in the node and on each method context (displaying the stack frames) shows task IDs instead of thread IDs.
Here is an example where one thread is not running tasks (the Main thread):
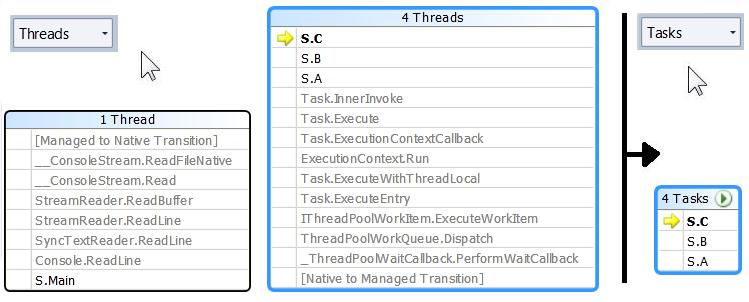 Trimming frames from the bottom
 You will notice in the screenshot above another difference not mentioned so far: some stack frames at the root of the call stack are trimmed. This is what I call showing the "real" call stacks of tasks. If you think about it, your code created a task pointing it to a method and it is from somewhere close to that method that you want to start looking at the call stack. All the other (typically non-user code) stack frames at the root of the thread's call stack are not of interest in this Tasks View, so we trim them out (as per screenshot above).
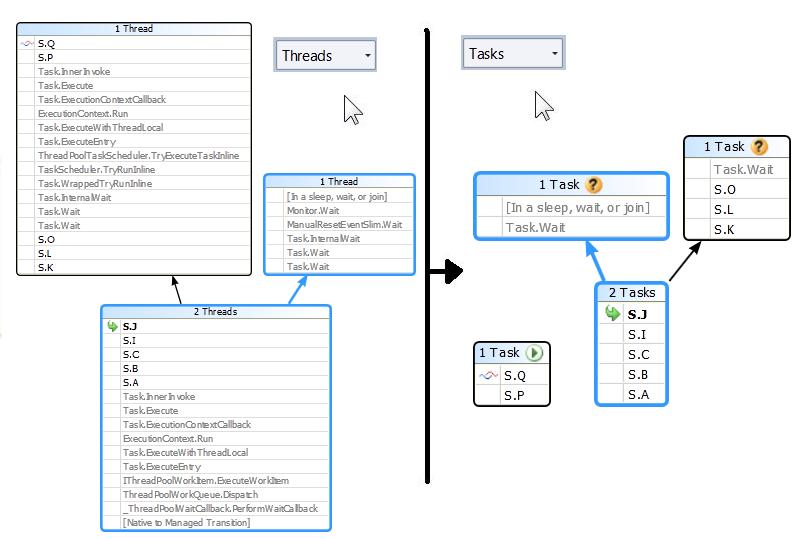
Trimming frames from the topWe also trim stack frames from the top of the call stack. The consistent decision could have been to trim *all* non-user code at the top since that is not code you would typically care too much about when debugging tasks. However, what is interesting in many scenarios is the first non-user method that was called from the top most user frame – so we kept that one frame and trimmed all the ones above it.
Here is an example of trimming stack frames from the top and also of a thread running 2 tasks:
 "Go To Thread" and "Go To Task" menu
Before anyone panics with the stack trimming I mentioned above, remember that you can always view entire
thread call stacks in this window by switching to the Threads View. In fact, we made it even easier to switch not just view, but also scroll to the exact position you want by offering a menu item (you'll recall I left that out from my context
menu description last time) that switches views and scrolls to the same stack frame you are looking in the other view.
Header IconThe header of each node shows the count of Threads or Tasks depending on the view we are on (default Threads View or Tasks View). In Tasks View, it also shows the task Status icon if a task's topmost frame ends in that node. You can see that in the previous screenshot: the node with 1 running task has the running icon; the two nodes each with a waiting task have the waiting icon; the node with 2 tasks has none that "end" in that box, so it shows no icon in the header.
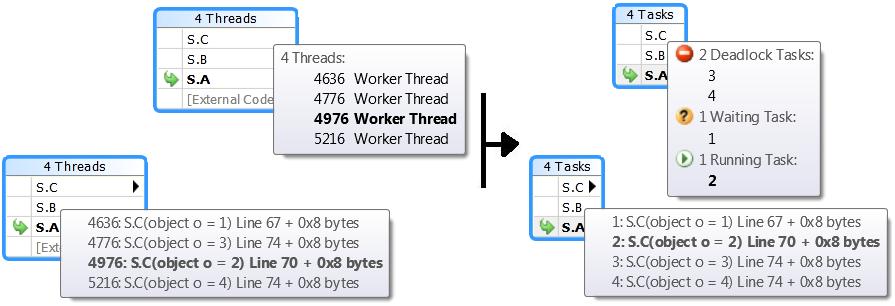
Header tooltipI mentioned the method context tooltip showing task IDs instead of thread IDs and you can see that in the screenshot below. I also mentioned the header tooltip showing task IDs instead of thread IDs; for this tooltip we threw in bonus information by showing you the Status of each task including counts for each status grouping regardless of whether there is an icon showing in the header or not (and if there are more than one appdomain in your app, we show the appdomain ID next to the task ID)
 Feedback Please
Start playing with Visual Studio 2010 and let me have it!