Sat, November 14, 2009, 11:55 PM under
ParallelComputing |
HPC
Let's assume that you have all the
HPC bits installed and that you have existing
MPI code (or you created a "Hello World" project using the
MPI project template). Of course, you create a single MPI application and at runtime it will correspond to multiple processes (of the same app) launched on multiple nodes (i.e. machines) on the cluster. So how do you debug such a situation by simply hitting the familiar "F5" keystroke (i.e. Debug -> Start Debugging)?
WATCH IT INSTEAD OF READING ABOUT ITIf you can't bear to read through all the details below, just watch this
19-minute screencast explaining this VS2010 feature. Alternatively, or even additionally, keep on reading.
REQUIREMENTWhen you debug an MPI application, you would want the copying of resources from your client machine (where Visual Studio is installed) to each compute node (where Windows HPC Server is installed) to take place automatically for you. 'Resources' in the previous sentence includes your application binary, plus any binary or data dependencies it may have, plus
PDBs if needed, plus the debug
CRT of the correct bitness, plus msvsmon for remote debugging to work. You would also want, after copying is complete, to have your app and msvsmon launched and attached so that you can hit breakpoints back in Visual Studio on your client machine. All these thing that you would want are delivered in VS2010.
STEPS TO F51. In your MPI project where you have placed a breakpoint go to Project Properties -> Configuration Properties -> Debugging. Ensure the "Debugger to launch" combo box value is set to
MPI Cluster Debugger.
2. There are a whole bunch of properties here and typically you can ignore all of them except one:
Run Environment. By default it is set to run 1 process on your local machine and if you change the number after that to, for example, 4 it will launch 4 processes of your app on your local machine.
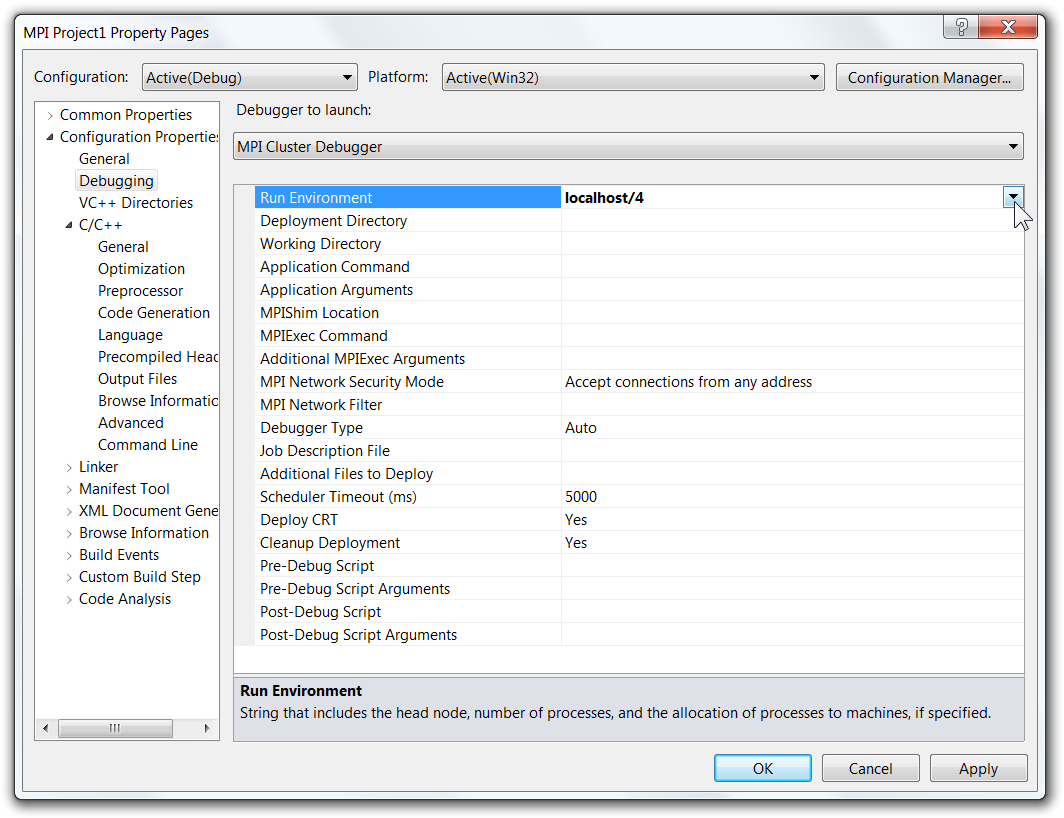
You want this to run on your cluster though, so go to the dropdown arrow at the end of the Run Environment cell and open it to expose the "Edit Hpc node" menu which opens the
Node Selector dialog:
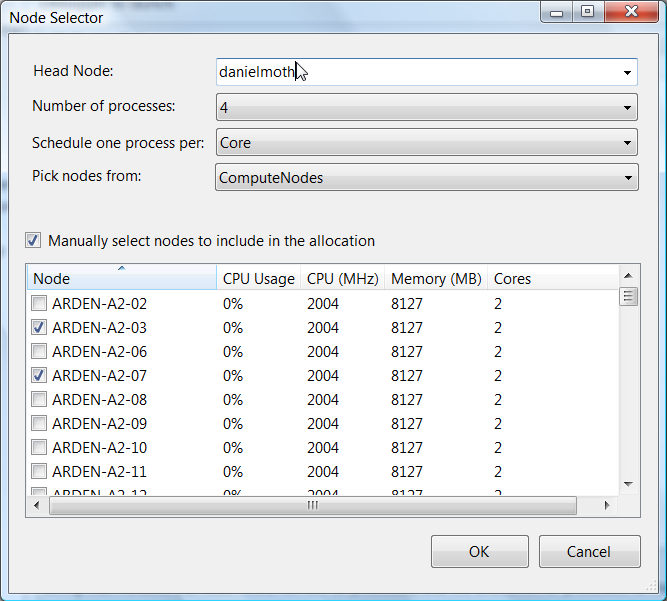
In this dialog you can enter (or pick from a list) the cluster head node name and then the number of processes you want to execute on the cluster and then hit OK and… you are done.
3. Press F5 and watch your breakpoint get hit (after giving it some time for copying, remote execution, attachment and symbol resolution to take place).
GOING DEEPERIn the MPI Cluster Debugger project properties above, you can see many additional properties to the Run Environment. They are all optional, but you may want to understand them in order to fine tune your cluster debugging. Read all about each one of these on the MSDN page
Configuration Properties for the MPI Cluster Debugger.
In the Node Selector dialog above you can see more options than just the Head Node name and Number of Process to run. They should be self-explanatory but I also cover them in depth in
my screencast showing you an example of why you would choose to schedule processes per core versus per node. You can also read about these options on MSDN as part of the page
How to: Configure and Launch the MPI Cluster Debugger.
To read through an example that touches on MPI project creation, project properties, node selector, and also usage of MPI with OpenMP plus MPI with PPL, read the MSDN page
Walkthrough: Launching the MPI Cluster Debugger in Visual Studio 2010.
Happy MPI debugging!