The last word on C++ AMP...

Fri, August 31, 2012, 12:47 PM under GPGPU | ParallelComputing

Well, not the last word, but the last blog post I plan to do here on that topic.

Over the last 12 months, I have published 45 blog posts related to C++ AMP on the Parallel Programming in Native Code, and the rest of the team has published even more. Occasionally I'll link to some of them from my own blog here, but today I decided to stop doing that - so if you relied on my personal blog pointing you to C++ AMP content, it is time you subscribed to the msdn blog. I will continue to blog about other topics here of course, so stay tuned.

So, for the last time, I encourage you to read the latest two blog posts I published on the team blog bringing together essential reading material on C++ AMP

Got questions on C++ AMP? Hit the msdn forum!


Get started with C++ AMP

Tue, July 24, 2012, 11:22 PM under GPGPU | ParallelComputing

With the imminent release of Visual Studio 2012, even if you do not classify yourself as a C++ developer, C++ AMP is something you should learn so you can understand how to speed up your loops by offloading to the GPU the computation performed in the loop (assuming you have large number of iterations/data). We have many C# customers who are using C++ AMP through pinvoke, and of course many more directly from C++.

So regardless of your programming language, I hope you'll find helpful these short videos that help you get started with C++ AMP

  1. C++ AMP core API introduction... from scratch
  2. Tiling Introduction - C++ AMP
  3. Matrix Multiplication with C++ AMP
  4. GPU debugging in Visual Studio 2012

In particular the work we have done for parallel and GPU debugging in Visual Studio 2012 is market leading, so check it out!


Attend my Fusion sessions

Wed, June 6, 2012, 07:50 PM under Events | GPGPU | ParallelComputing

The inaugural Fusion conference was 1 year ago in June 2011 and I was there doing a demo in the keynote, and also presenting a breakout session. If you look at the abstract and title for that session you won't see the term "C++ AMP" in there because the technology wasn't announced and we didn't want to spill the beans ahead of the keynote, where the technology was announced. It was only an announcement, we did not give any bits out, and in fact the first bits came three months later in September 2011 with the Beta following in February 2012.

So it really feels great 1 year later, to be back at Fusion presenting two sessions on C++ AMP, demonstrating our progress from that announcement, to the Visual Studio 2012 Release Candidate that came out last week.

If you are attending Fusion (in person or virtually later), be sure to watch my two-part session. Part 1 is PT-3601 on Tuesday 4pm and part 2 is PT-3602 on Wednesday 4pm. Here is the shared abstract for both parts:

Harnessing GPU Compute with C++ AMP

C++ AMP is an open specification for taking advantage of accelerators like the GPU. In this session we will explore the C++ AMP implementation in Microsoft Visual Studio 2012. After a quick overview of the technology understanding its goals and its differentiation compared with other approaches, we will dive into the programming model and its modern C++ API. This is a code heavy, interactive, two-part session, where every part of the library will be explained. Demos will include showing off the richest parallel and GPU debugging story on the market, in the upcoming Visual Studio release.

See you there!


Attend my GTC sessions

Sun, May 13, 2012, 01:36 PM under Events | GPGPU | ParallelComputing

The last GTC conference in the US was 2 years ago and I was there as an attendee. You may recall from that blog post that we were running UX studies at the time.

It really feels great 2 years later, to be back at GTC presenting two sessions on C++ AMP, demonstrating our progress that includes input from those early studies.

If you are attending GTC (in person or virtually later), be sure to watch my two-part session. Part 1 is S0242 on Wednesday 5pm and part 2 is S0244 on Thursday 10am. Here is the shared abstract for both parts:

Harnessing GPU Compute with C++ AMP

C++ AMP is an open specification for taking advantage of accelerators like the GPU. In this session we will explore the C++ AMP implementation in Microsoft Visual Studio 11 Beta. After a quick overview of the technology understanding its goals and its differentiation compared with other approaches, we will dive into the programming model and its modern C++ API. This is a code heavy, interactive, two-part session, where every part of the library will be explained. Demos will include showing off the richest parallel and GPU debugging story on the market, in the upcoming Visual Studio release.

See you there!


Visual Studio Exceptions dialogs

Tue, May 1, 2012, 07:03 PM under VisualStudio

Previously I covered step 1 of live debugging with start and attach. Once the debugger is attached, you want to go to step 2 of live debugging, which is to break.

One way to break under the debugger is to do nothing, and just wait for an exception to occur in your code. This is true for all types of code that you debug in Visual Studio, and let's consider the following piece of C# code:

3:  static void Main()
4:  {
5:    try
6:    {
7:      int i = 0;
8:      int r = 5 / i;
9:    }
10:    catch (System.DivideByZeroException) {/*gulp. sue me.*/}
11:    System.Console.ReadLine();
12: }

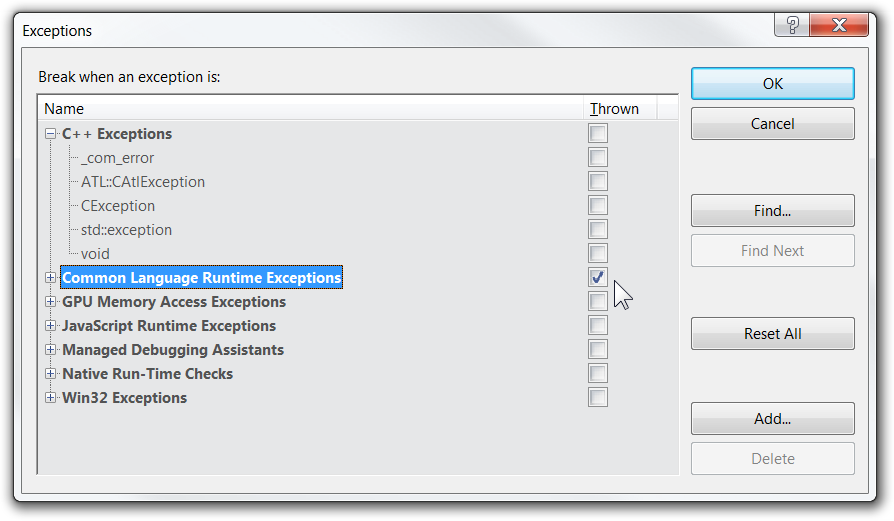
If you run this under the debugger do you expect an exception on line 8? It is a trick question: you have to know whether I have configured the debugger to break when exceptions are thrown (first-chance exceptions) or only when they are unhandled. The place you do that is in the Exceptions dialog which is accessible from the Debug->Exceptions menu and on my installation looks like this:
image

Note that I have checked all CLR exceptions. I could have expanded (like shown for the C++ case in my screenshot) and selected specific exceptions. To read more about this dialog, please read the corresponding Exception Handling debugging msdn topic and all its subtopics.

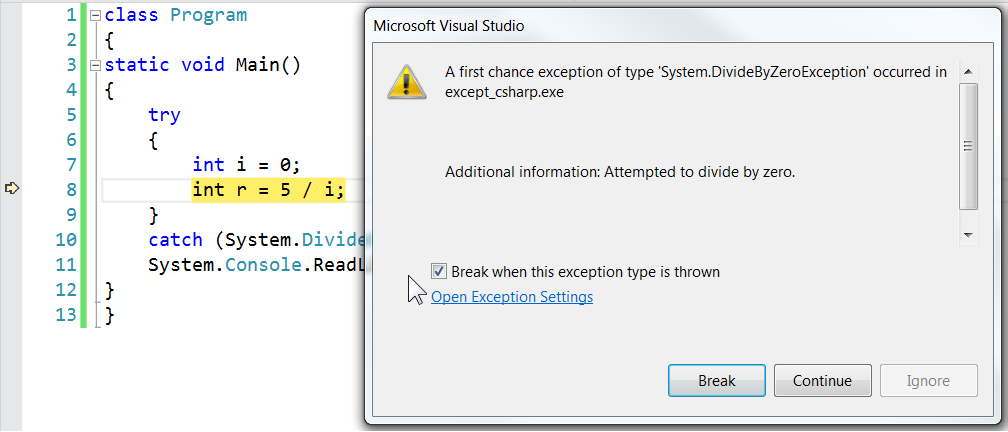
So, for the code above, the debugger will break execution due to the thrown exception (exactly as if the try..catch was not there), so I see the following Exception Thrown dialog:
image

Note the following:

  1. I can hit continue (or hit break and then later continue) and the program will continue fine since I have a catch handler.
  2. If this was an unhandled exception, then that is what the dialog would say (instead of first chance exception) and continuing would crash the app.
  3. That hyperlinked text ("Open Exception Settings") opens the Exceptions dialog I described further up.
  4. The coolest thing to note is the checkbox - this is new in this latest release of Visual Studio: it is a shortcut to the checkbox in the Exceptions dialog, so you don't have to open it to change this setting for this specific exception - you can toggle that option right from this dialog.

Finally, if you try the code above on your system, you may observe a couple of differences from my screenshots. The first is that you may have an additional column of checkboxes in the Exceptions dialog. The second is that the last dialog I shared may look different to you. It all depends on the Debug->Options settings, and the two relevant settings are in this screenshot:

image

The Exception assistant is what configures the look of the UI when the debugger wants to indicate exception to you, and the Just My Code setting controls the extra column in the Exception dialog. You can read more about those options on MSDN: How to break on User-Unhandled exceptions (plus Gregg’s post) and Exception Assistant.

Before I leave you to go play with this stuff a bit more, please note that this level of debugging is now available for JavaScript too, and if you are looking at the Exceptions dialog and wondering what the "GPU Memory Access Exceptions" node is about, stay tuned on the C++ AMP blog ;-)


Screencasts introducing C++ AMP

Thu, April 12, 2012, 07:07 PM under GPGPU | ParallelComputing

It has been almost 2.5 years since I last recorded a screencast, and I had forgotten how time consuming they are to plan/record/edit/produce/publish, but at the same time so much fun to see the end result!

So below are links to 4 screencasts to teach you C++ AMP basics from scratch (even if you class yourself as a .NET developer you'll be able to follow).

  1. Setup code - part 1
  2. array_view, extent, index - part 2
  3. parallel_for_each - part 3
  4. accelerator - part 4

If you have comments/questions about what is shown in each video, please leave them at each video recoding. If you have generic questions about C++ AMP, please ask in the C++ AMP MSDN forum.


My MSDN magazine articles are live

Mon, April 2, 2012, 07:01 AM under GPGPU | ParallelComputing

Five years ago I wrote my first MSDN magazine article, and 21 months later I wrote my second MSDN Magazine article (during the VS 2010 Beta). By my calculation, that makes it two and a half years without having written anything for my favorite developer magazine!

So, I came back with a vengeance, and in this month's April issue of the MSDN magazine you can find two articles from yours truly - enjoy:

  1. A Code-Based Introduction to C++ AMP
  2. Introduction to Tiling in C++ AMP

For more on C++ AMP, please remember that I blog about it on our team blog, and we take questions in our MSDN forum.


Start Debugging in Visual Studio

Thu, March 15, 2012, 07:05 PM under VisualStudio

Every developer is familiar with hitting F5 and debugging their application, which starts their app with the Visual Studio debugger attached from the start (instead of attaching later). This is one way to achieve step 1 of the Live Debugging process.

Hitting F5, F11, Ctrl+F10 and the other ways to start the process under the debugger is covered in this MSDN "How To".

The way you configure the debugging experience, before you hit F5, is by selecting the "Project" and then the "Properties" menu (Alt+F7 on my keyboard bindings). Dependent on your project type there are different options, but if you browse to the Debug (or Debugging) node in the properties page you'll have a way to select local or remote machine debugging, what debug engines to use, command line arguments to use during debugging etc.

Currently the .NET and C++ project systems are different, but one would hope that one day they would be unified to use the same mechanism and UI (I don't work on that product team so I have no knowledge of whether that is a goal or if it will ever happen). Personally I like the C++ one better, here is what it looks like (and it is described on this MSDN page):

image

If you were following along in the "Attach to Process" blog post, the equivalent to the "Select Code Type" dialog is the "Debugger Type" dropdown: that is how you change the debug engine.

Some of the debugger properties options appear on the standard toolbar in VS. With Visual Studio 11, the Debug Type option has been added to the toolbar

image

If you don't see that in your installation, customize the toolbar to show it - VS 11 tends to be conservative in what you see by default, especially for the non-C++ Visual Studio profiles.


Attach to Process in Visual Studio

Thu, March 15, 2012, 01:51 PM under VisualStudio

One option for achieving step 1 in the Live Debugging process is attaching to an already running instance of the process that hosts your code, and this is a good place for me to talk about debug engines.

You can attach to a process by selecting the "Debug" menu and then the "Attach To Process…" menu in Visual Studio 11 (Ctrl+Alt+P with my keyboard bindings), and you should see something like this screenshot:

clip_image001

I am not going to explain this UI, besides being fairly intuitive, there is good documentation on MSDN for the Attach dialog.

I do want to focus on the row of controls that starts with the "Attach to:" label and ends with the "Select..." button. Between them is the readonly textbox that indicates the debug engine that will be used for the selected process if you click the "Attach" button. If you haven't encountered that term before, read on MSDN about debug engines.

Notice that the "Type" column shows the Code Type(s) that can be detected for the process. Typically each debug engine knows how to debug a specific code type (the two terms tend to be used interchangeably). If you click on a different process in the list with a different code type, the debug engine used will be different. However note that this is the automatic behavior. If you believe you know best, or more typically you want to choose the debug engine for a process using more than one code type, you can do so by clicking the "Select..." button, which should yield a "Select Code Type" dialog like this one:

image

In this dialog you can switch to the debug engine you want to use by checking the box in front of your desired one, then hit "OK", then hit "Attach" to use it.

Notice that the dialog suggests that you can select more than one. Not all combinations work (you'll get an error if you select two incompatible debug engines), but some do. Also notice in the list of debug engines one of the new players in Visual Studio 11, the GPU debug engine - I will be covering that on the C++ AMP team blog (and no, it cannot be combined with any others in this release).


Live Debugging

Tue, March 13, 2012, 07:33 PM under Random | SoftwareProcess

Based on my classification of diagnostics, you should know what live debugging is NOT about - at least according to me :-) and in this post I'll share how I think of live debugging.

These are the (outer) steps to live debugging

  1. Get the debugger in the picture.
  2. Control program execution.
  3. Inspect state.
  4. Iterate between 2 and 3 as necessary.
  5. Stop debugging (and potentially start new iteration going back to step 1).

Step 1 has two options: start with the debugger attached, or execute your binary separately and attach the debugger later. You might say there is a 3rd option, where the app notifies you that there is an issue, referred to as JIT debugging. However, that is just a variation of the attach because that is when you start the debugging session: when you attach. I'll be covering in future posts how this step works in Visual Studio.

Step 2 is about pausing (or breaking) your app so that it makes no progress and remains "frozen". A sub-variation is to pause only parts of its execution, or in other words to freeze individual threads. I'll be covering in future posts the various ways you can perform this step in Visual Studio.

Step 3, is about seeing what the state of your program is when you have paused it. Typically it involves comparing the state you are finding, with a mental picture of what you thought the state would be. Or simply checking invariants about the intended state of the app, with the actual state of the app. I'll be covering in future posts the various ways you can perform this step in Visual Studio.

Step 4 is necessary if you need to inspect more state - rinse and repeat. Self-explanatory, and will be covered as part of steps 2 & 3.

Step 5 is the most straightforward, with 3 options: Detach the debugger; terminate your binary though the normal way that it terminates (e.g. close the main window); and, terminate the debugging session through your debugger with a result that it terminates the execution of your program too. In a future post I'll cover the ways you can detach or terminate the debugger in Visual Studio.

I found an old picture I used to use to map the steps above on Visual Studio 2010. It is basically the Debug menu with colored rectangles around each menu mapping the menu to one of the first 3 steps (step 5 was merged with step 1 for that slide). Here it is in case it helps:

live debugging

Stay tuned for more...