Wed, October 1, 2008, 02:31 PM under
ParallelComputing
Previously I asked about
properties of Tasks that you'd like to see when debugging and suggested some:
[...]which ones are not scheduled yet [...], which ones are Running and which ones have run a bit and now are Waiting [...]. [...]quickly see the call stack of each Task and also which thread it is executing on. [...]parent-child relationship between Tasks.
Rather than talk about it in totally abstract terms, how about having a few mock up pictures.
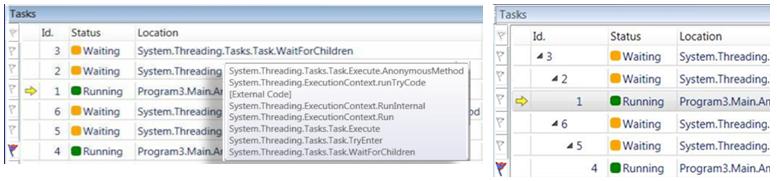
After hitting a breakpoint, below are 2 Tasks running and 4 that are waiting (in our example there aren't any Tasks that are scheduled in a queue and not run yet). Then on the picture on the right, we switch to parent child view, we can see that four Tasks are actually waiting for their child tasks to complete:
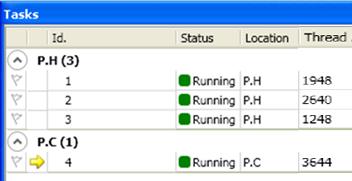
In this different example below, we grouped by the Location column so we can see that 3 Tasks are running in method H of class P, and 1 task has at the top of its stack the method C of the same class. We also see the IDs of the underlying threads running those Tasks:
I can't wait for you to start working with the Task-based APIs, so you can provide feedback on what supporting tools you'd like to see. Hopefully the
Parallel Tasks debugger toolwindow is a good start.