This post was UPDATED for the VS2010 Beta 2 releaseAssumed knowledge aka Background Reading.NET 4 introduces a new class that lives in mscorlib that I have blogged about before:
System.Threading.Tasks.Task, which as you'll recall is also what
Parallel.For depends on. Collectively, all those new classes is what we refer to as Task Parallel Library and the team that owns it has blogged what is
new for TPL in Beta1. Another .NET 4 feature I blogged about before also depends on Tasks for its implementation:
Parallel LINQ. The same team owns that and there is a blog post of what is
new for PLINQ in Beta1.
If you are a C++ developer, then you'll be happy to know that the
task concept also exists in C++ version 10 that ships with VS2010. In addition to the dedicated native concurrency blog I just linked to, there is a
ch9 video on the topic.
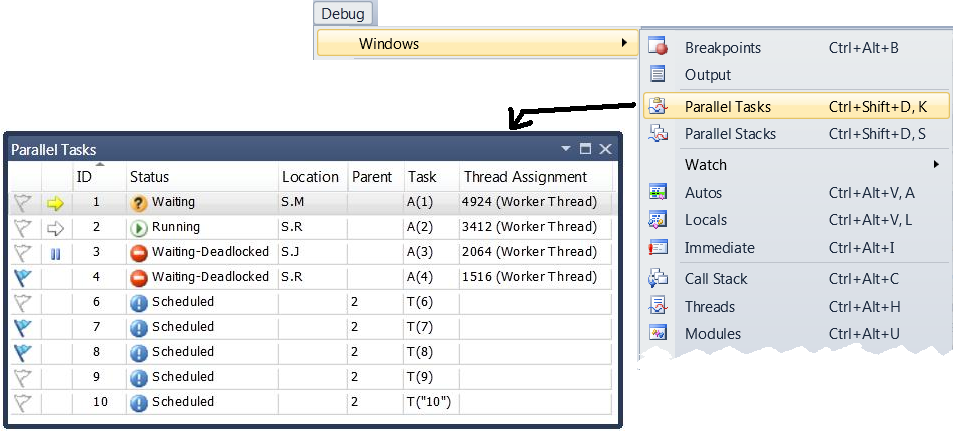
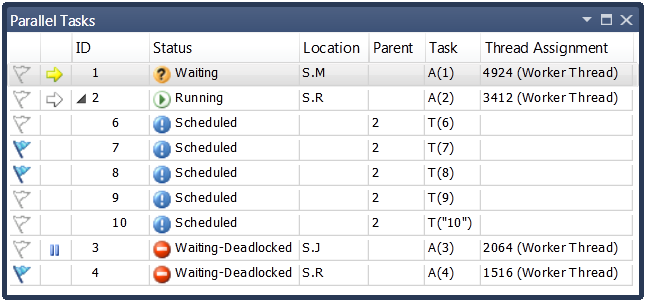
Parallel Tasks debugger toolwindowTo support the new task-based programming model introduced with Visual Studio 2010 for both managed and native developers, we are introducing a new debugger window: Parallel Tasks. You can open it after you hit a breakpoint, via the same location where all debugger windows live.
 Sorting, Reordering, Hiding/Showing columns
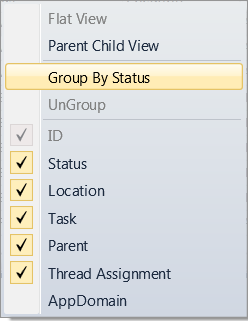
 Columns are re-orderable (by dragging them left/right) and sortable (by clicking on them) as indicated by the little triangle, which also shows the sort direction. You can also hide or show columns by right clicking on any column and then (un)checking the column menuitem of interest
 Grouping on a column
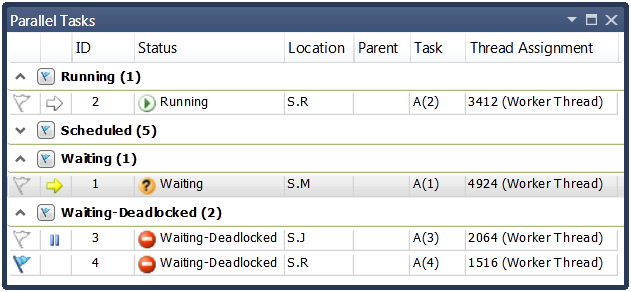
Via the context menu shown above you can group on your column of choice. What is cool about grouping is that it allows you to flag an entire group with one click (more on flagging later), it allows you to collapse the group (preserved between debugging steps) and it shows a count of the items in the group (even when it is collapsed).
 Description of the 9 Columns- Flag Column
: Each item can be in a flagged or non-flagged state (the default). You can toggle the state of a row by clicking on the corresponding cell. You would do this to make it easier to keep an eye on an item of interest between debugging steps (e.g. breakpoints, F11) or to flag multiple items and then sort on the column to bring them all to the top. Flagging is not persisted between debugging sessions. Another use of flagging is to filter the task call stacks shown in the new Parallel Stacks window, but that is a topic of another blog post.
- Icon Column: This column is blank by default except for one Task which will have a yellow arrow in this cell. The yellow arrow indicates which one is the current task. The current task is one which is executing on the
current thread and you can switch current task just like switching current thread. The task which is current when you first break under the debugger is known as the "breaking task" and is indicated by a white hollow arrow icon (only visible after you switch task, of course). Another icon that can be displayed in this column is the "pause" icon to indicate a frozen thread (more on freezing further down).
- Id: Each Task has a unique Id which can be retrieved programmatically by calling the Id property (for C++ tasks, this will be the memory address). This is useful so you can map the task you are seeing in the window with diagnostic output you may send to some stream; it is also useful for cross-referencing tasks between the Parallel Tasks and the Parallel Stacks windows (which I'll describe in another post).
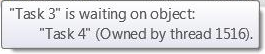
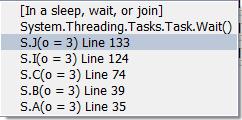
- Status: The 4 potential values here are Running, Scheduled, Waiting and Waiting-Deadlocked. "Running" are the tasks that are executing code at the moment your app breaks in the debugger (they are at top of stack of a running thread); "Scheduled" are the ones that are sitting in some queue but have not been executed by a thread yet; "Waiting" are the ones that have run, but are now blocked on something, e.g. a Monitor, a critical section; "Waiting-Deadlocked" are the ones that are "Waiting" and additionally we have detected a wait chain with other tasks in the list. For the 2 Waiting states, hovering over the cell displays a tooltip which may have more information, like in the following screenshot.
 - Location
: The Location column displays the method that the task is currently in (i.e. the top most user frame of the task's call stack). Hovering over the cell displays in a stacktip the entire call stack for the task (not the entire call stack for the thread!) and from the stacktip you can even switch the current stack frame by double clicking on your chosen one. Naturally, Scheduled tasks do not have a value in this column.
 - Task
: The entry point method that was passed to the task when it was constructed. If there was a state argument explicitly passed to the task, the value of that is also shown.
- Thread Assignment: The ID and name of the thread that the task is executing on. Remember, a task can only execute on a single thread, but a thread can be executing multiple tasks. Naturally, Scheduled tasks do not have a value in this column.
- Parent: The Id of the task that is the parent of this task (if there is one showing in the list). This is not applicable for
native scenarios where the concept of parent and child tasks is not a first class citizen in the programming model.
- AppDomain: This column shows the AppDomain ID of the AppDomain in which the task belongs to (assuming you created more than one AppDomain). This is not applicable for native scenarios.
- Task Group: The address of the task_group that scheduled the task. This is not applicable for managed scenarios.
Parent Child ViewWhen the value of any cell in the Parent column is not blank, we know we have parent child relationship(s) in our view. In that case, we can visualize this relationship slightly better by switching to "Parent Child View" via the column context menu (shown in image further above). This switches the first column to contain a treeview that allows collapsing the child nodes/tasks.
 Task Context Menu
The ContextMenu described above is the one displayed when right clicking on a column; there is one that is displayed when right clicking on a (task) listviewitem.
- Copy: Copies the cells in view (tab delimited) to the clipboard.
- Select All: Or via Ctrl+A to select all tasks, in order to perform one of the other operations in bulk, e.g. copying.
- Hexadecimal Display: Global debugger setting that switches all debugger windows to hexadecimal display (or Decimal if unchecked).
- Switch To Task: Sets the selected task to be the current task (as discussed above) and hence get the yellow arrow icon. This action is also performed when double clicking on a Task listviewitem.
- Freeze Assigned Thread: The concept of freezing a thread existed before this Visual Studio release via the Threads window. The thread that is frozen does not continue execution when the debugger continues to the next step, until the user Thaws it (via the same menu). From the Parallel Tasks window, freezing affects the underlying thread and all tasks on it. I.e. this is still a thread concept rather than a task concept.
- Freeze All Threads But This: Freezes all threads in view, except the selected one.
- Flag: Same behaviour as clicking on the flag column, described further above.
 Call to Action
When you get the Visual Studio 2010, let me know what you think about this new debugger window as you write your own task-based algorithms: do you like it or do you love it? ;-) More seriously, I am genuinely interested in your bug reports (so the talented developers on my team can fix them for future releases), what feature do you particularly like (so we make sure not to lose/break it) and what you'd like to see that is not there (so we can include it for the next release).